Stations as well as grids
132,437 weather stations in GHCN-Daily alone, plus snow, soil, airport and buoy networks. Ask for the nearest one and it tells you how far away it is.
 Data MarketplaceGlobal climate datasets, cleaned and ready to use by dClimate
Name a place, a variable and a date range. You get exactly that slice in Python or JavaScript, cleaned, gridded and current, with a fingerprint that returns the same numbers every time. It’s the same data our own products use.
Hourly temperature at London Heathrow const [heathrow] = await new DClimateClient().selectDataset({ request: { organization: "ecmwf", collection: "era5", dataset: "temperature_2m", variant: "finalized" }, selection: { point: { latitude: 51.47, longitude: -0.45 }, timeRange: { start: "2022-07-18T00:00:00Z", end: "2022-07-20T23:00:00Z" } },});const hours = await heathrow.toRecords("2m_temperature");async with dClimateClient() as dclimate: era5, meta = await dclimate.load_dataset(dataset="temperature_2m", collection="era5", organization="ecmwf", variant="finalized") hours = era5.point(latitude=51.47, longitude=-0.45).time_range( datetime(2022, 7, 18), datetime(2022, 7, 20, 23)).as_dict()Returns the 72 hourly values shown in the chart.
In the catalogue
ERA5 GFS IFS AIFS PRISM GHCN-Daily METAR airports +9 more
On 19 July 2022 the UK passed 40 °C for the first time. Here is that day at London Heathrow, pulled from the record with the few lines behind “For developers” above, one step at a time.
In plain words
ReanalysisA weather model replayed over the past with every observation it can get, giving a consistent picture of every hour, everywhere.
ZarrA format that stores huge grids in small chunks, so you read only the slice you ask for.
IPFSA network that finds files by a fingerprint of their contents, not by which server holds them.
STACA standard catalogue format that says what each dataset is, where it covers and when.
The catalogue runs from ECMWF and NOAA models to station networks. Hourly temperature for any place on Earth lives in ERA5.
The full dataset holds 787,999,242,240 values: every hour since 1940 for every quarter-degree square of the globe. You ask for one square and three days, and only those are read.
The catalogue hands back a fingerprint of the exact data (a content address, or CID). The client uses it to fetch the data from the IPFS network. Same fingerprint, same numbers, whoever asks and whenever. Our run took 6.7 seconds.
Seventy-two hourly values arrive on the scientific temperature scale (kelvin); take away 273.15 for Celsius. The afternoon of the 19th peaks at 36.7 °C at 13:00 UTC, and the next day falls back to 24 °C.
The same client reads weather stations too. Heathrow's own thermometer logged 40.2 °C that day. ERA5 doesn't measure one spot: it gives the average over a square about 28 by 17 km, from a weather model replayed over the past (a reanalysis), so its peak runs cooler. Both are right; they answer different questions, and now you can see both.
Pulled with the dClimate JavaScript client 0.12.0, using the request shown under “For developers” at the top. The Python version makes the same request, following the client's README. Station value: GHCN-Daily TMAX for UKM00003772, 19 July 2022. Download the 72 hours as CSV.
Every collection and dataset the dClimate clients list today. Filter by kind, search for a variable or a source, and open a collection to see what it holds.
copernicus_clms Historical 1 dataset fparecmwf_aifs Forecast 6 datasets wind_v_forecastwind_u_forecasttemperature_forecastdew_point_forecastsolar_radiation_forecastprecipitation_forecastecmwf_era5 Historical 8 datasets solar_radiation_surfaceprecipitation_totalwind_v_10m_landwind_u_10m_landprecipitation_total_landwind_v_10mwind_u_10mtemperature_2mecmwf_era5_daily Historical 2 datasets temperature_2mprecipitation_totalecmwf_ifs Forecast 7 datasets wind_u_forecasttemperature_forecastsoil_moisture_l3_forecastdew_point_forecastwind_v_forecastsolar_radiation_forecastprecipitation_forecastiem_metar Historical 1 dataset airport_observationsnoaa_aigfs Forecast 4 datasets wind_v_forecastwind_u_forecasttemperature_forecastprecipitation_total_forecastnoaa_cpc Historical 4 datasets precipitation_conustemperature_mintemperature_maxprecipitation_globalnoaa_eagle Forecast 4 datasets wind_v_forecastwind_u_forecasttemperature_forecastprecipitation_total_forecastnoaa_gfs Forecast 8 datasets wind_v_forecastwind_u_forecastrelative_humidity_forecasttemperature_mean_forecasttemperature_min_forecasttemperature_max_forecastprecipitation_total_forecastprecipitation_rate_forecastnoaa_ghcnd Historical 1 dataset station_observationsnoaa_ndbc Historical 1 dataset buoy_observationsprism_prism Historical 3 datasets temperature_min_800mtemperature_max_800mprecipitation_800musda_rma Historical 6 datasets rma-prf-termsrma-prf-ratesrma-prf-paid-indexrma-prf-gridsrma-county-yieldsrma-prf-indexusda_scan Historical 1 dataset station_observationsusda_snotel Historical 1 dataset station_observationsNothing in the catalogue matches “”. Try , or .
The list comes straight from listAvailableDatasets() in the dClimate JavaScript client 0.12.0. Each dataset can hold more than one variant, such as finalized and non-finalized; those aren’t shown here.
Ask for any shape, read stations next to grids, and publish data of your own.
132,437 weather stations in GHCN-Daily alone, plus snow, soil, airport and buoy networks. Ask for the nearest one and it tells you how far away it is.
A single point, a radius in kilometres, a box, or your own fields from GeoJSON or KML. Only the cells inside are read.
Share or sell your data on the Marketplace, as one file or an ongoing subscription.
Four common starting points. Each begins with one line.

Put weather into an app without building a data pipeline first.
Start withnpm install @dclimate/dclimate-client-js
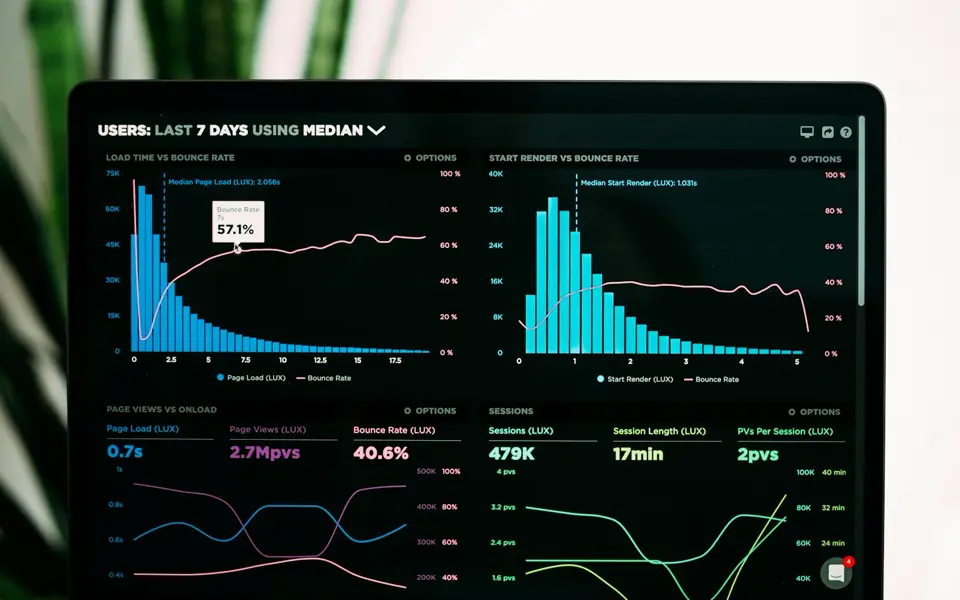
Grids that are cleaned and ready to use, straight into a notebook as an xarray dataset.
Start withload_dataset(…, return_xarray=True)
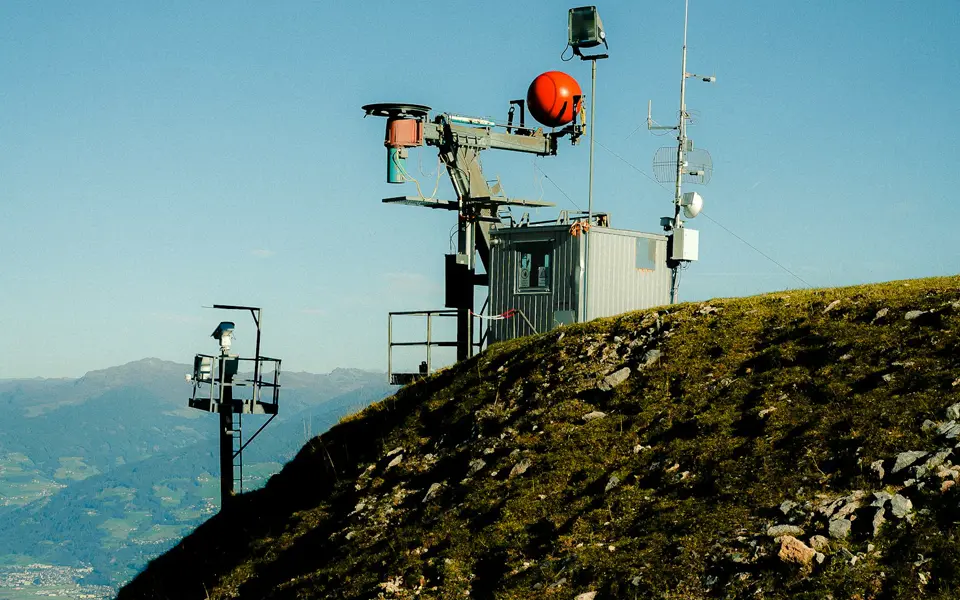
Station records next to gridded estimates, each with a fixed address you can cite.
Start withghcnd.circle(40.75, -73.99, 50)

“Where do I download ERA5?” You don’t. You pull the slice you need.
Start withpip install dclimate-client-py
Counted through the clients.
values in the hourly ERA5 temperature dataset alone
hourly ERA5 temperature for every hour since 1940
weather stations in GHCN-Daily, 132,437 to be exact
The short answers. For anything else, ask the team.
Climate and weather datasets that are cleaned, gridded and current, ready to pull into Python or JavaScript in a few lines. It is the same data dClimate's own products use.
58 datasets in 16 collections, including ERA5, IFS and AIFS from ECMWF, GFS and AIGFS from NOAA, GHCN-Daily weather stations, PRISM, airport and buoy observations, SNOTEL and USDA Risk Management Agency data.
Install the client (npm install @dclimate/dclimate-client-js, or pip install dclimate-client-py), then name a place, a variable and a date range.
No. Ask for a single point, a radius, a box or your own fields from GeoJSON or KML, and only the cells inside are read.
Yes. Each request is fetched by a fingerprint of the exact data (a content address on IPFS), so the same fingerprint returns the same numbers, whoever asks and whenever.
Yes. Share or sell your data on the Marketplace, as one file or an ongoing subscription.
Browse the catalogue on this page, or copy the snippet under “For developers” at the top and run it.
We use cookies to provide you with the best possible experience. They also allow us to analyse how the site is used so we can keep improving it. See our Privacy Policy.