Biomass, mapped from space
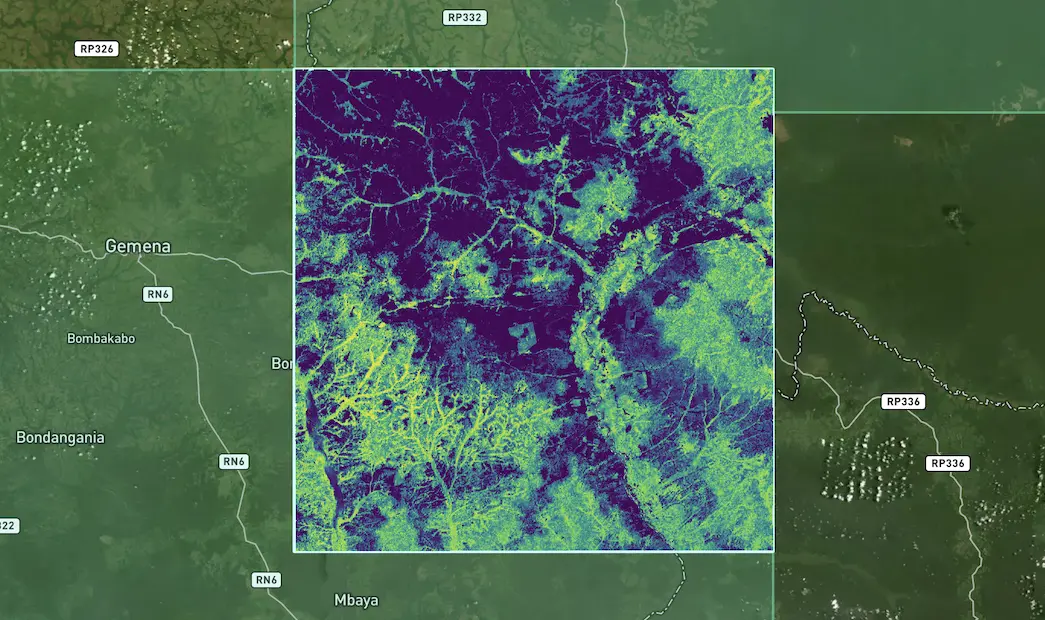
See how much living wood a landscape holds, as a map you can draw a boundary on. This is a real CYCLOPS above-ground biomass layer in northern DR Congo.
 CYCLOPSLand management by dClimate
Soil health first: CYCLOPS reads tillage and winter cover on every field from satellite images, season after season, then measures biomass for forest and restoration projects. That gives buyers and registries a record a verifier can check, field by field, known as digital MRV (measurement, reporting and verification).
Sourcing radius
Crop
Crop year
Crop carbon footprint check for the US 45Z clean-fuel credit
Estimated carbon footprint within 100 miles of your locations.
Fields analysed
26
Total acres
2,369
Soybeans volume
147,411 bu
Average carbon footprint
3.1 kg CO₂ per bushel
Estimated saving
17.9% lower
than conventional farming
Reads from orbit
Tillage Cover crops Carbon footprint Carbon stored Above-ground biomass Forest cover
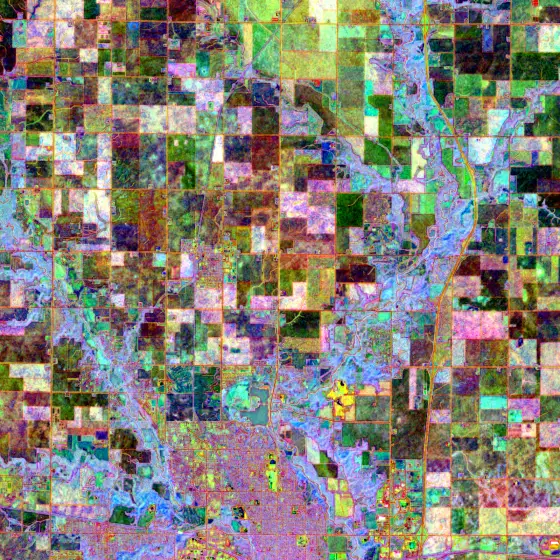
Take soil health first. A claim about it comes down to what happens in the field: how hard the soil is worked, whether it's covered over winter, and whether that holds year after year. Here is CYCLOPS checking the soybean fields around one buyer's plants, using the real numbers from the screen above.
Upload your plant or elevator locations and choose how far the crop comes from. CYCLOPS finds every soybean field inside the ring: none within 25 miles, 7 within 50, and 26 fields, 2,369 acres within 100.
Tillage means ploughing or turning the soil before planting. The less a field is tilled, the more carbon stays in the ground. CYCLOPS scores every field from satellite images on a 0 to 100 scale and sorts it into one of three groups, so nobody has to take the practice on trust. In 2025, 24 of 26 fields came out no-till.
A cover crop is planted between harvests to hold the soil over winter instead of leaving it bare. CYCLOPS flags where it sees one. In 2025 it marked a cover crop as possible on 6 fields, 478 acres, and not detected on the rest.
Practices change, so one season proves little. On these same fields the no-till share went from 76% of acres in 2023 to 50% in 2024 and back up to 96% in 2025. A one-off survey would have caught a single year. CYCLOPS reads every season, so each one has its own record to show a verifier.
Whoever buys the crop wants to know what those practices are worth. CYCLOPS turns them into a carbon footprint (carbon intensity): how much greenhouse gas it took to grow the crop, here in kilograms of CO₂ per bushel. Lower is better. For biofuel it can pay, too: 45Z, a US clean-fuel tax credit, pays more for fuel made from lower-carbon crops, which is what this footprint check is for. These fields average 3.1 kg, an estimated 17.9% lower than conventional farming.
All figures from the crop carbon footprint check in the CYCLOPS demo workspace, which the app calls 45Z CI Screening (soybeans, crop years 2023 to 2025), with field, grower and facility names removed. They are screening estimates. In the app's own words, official CI qualification still requires applicable program documentation. “CO₂” here is short for CO₂-equivalent (CO₂e), which counts every greenhouse gas as the amount of CO₂ with the same warming effect; the app and the download give the same footprints in grams. Download the numbers
Your boundaries, read from space
Draw a region on the map, upload a shapefile of your fields or project, or search a field ID. CYCLOPS reads whatever falls inside, on TESSERA, the 10-metre land model behind dClimate's EarthOS.
No-tillReduced tillConventional till
DetectedPossibleNot detected
01060100
kg CO₂ per bushel
Every season
GeoJSONCSVPDF
The satellite record that checks tillage on a soybean field also measures biomass and carbon for restoration and forest projects, and reports it the same way. One measurement setup, whether the claim is about soil, trees or both.
See how much living wood a landscape holds, as a map you can draw a boundary on. This is a real CYCLOPS above-ground biomass layer in northern DR Congo.
Above- and below-ground biomass, change over time and carbon stored, quarter by quarter, ready to export as GeoJSON, CSV or a PDF report.
From farmland and agroforestry to restoring degraded land, protecting standing forest and mangroves, with reports shaped for the standard you're registering under.
Anyone who has to stand behind a claim about how land is managed, whether they're buying the crop, making the claim, checking it or paying for it.
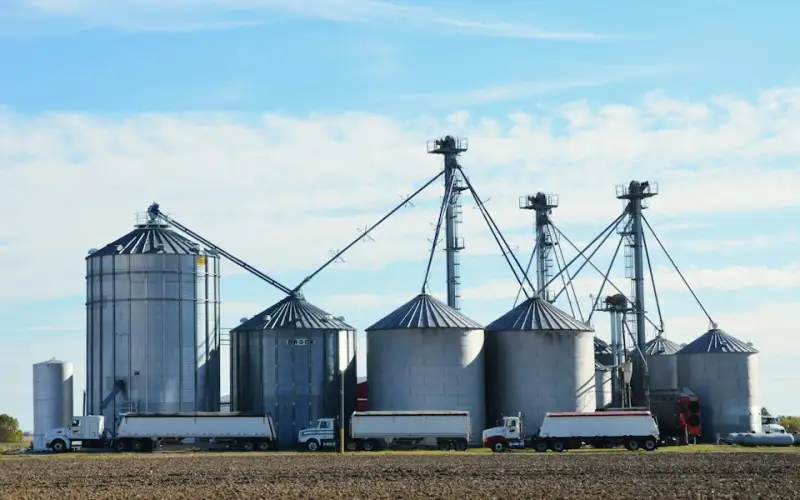
See how the fields you buy from are actually farmed, and put a carbon footprint figure on the crop, season by season.
A typical question“Which fields within 50 miles were no-till this season?”
Ask about sourcing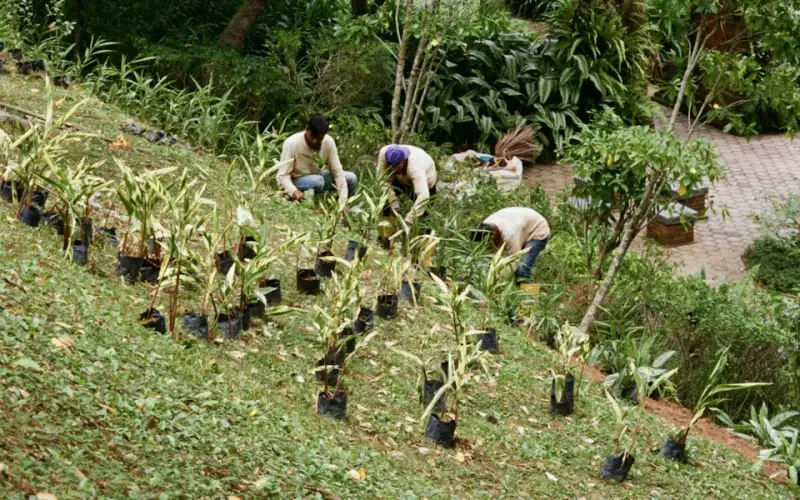
Show that a farmland or restoration project is doing what it says, with a record for every season and fewer site visits.
A typical question“Did the fields in our programme stay no-till this year?”
Ask about your project
Test a project's practice and carbon claims against an independent record of the land, season by season.
A typical question“Was this field really no-till in every season it claims?”
Ask about verification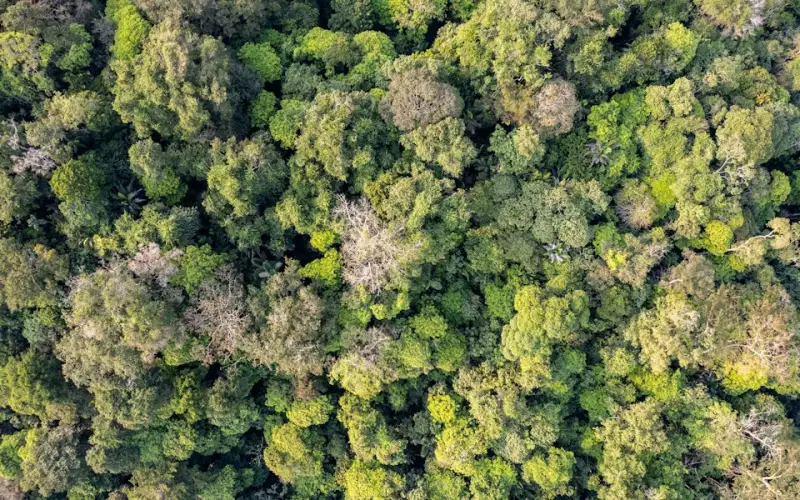
Know what sits behind a credit before you buy it, and keep watching after you do.
A typical question“Are the practices behind these credits still in place this season?”
Ask about creditsVerra, the carbon-credit standard-setter, has named CYCLOPS one of the vetted data providers for Verra's restoration standard (VM0047).
1 of 7
data providers Verra has vetted to measure vegetation change for projects under that standard.
10
countries where that CYCLOPS vegetation model already runs in restoration and agroforestry projects.
30
countries where CYCLOPS has worked so far, from Suriname to Sri Lanka.
Read the announcement · Verra still reviews every project on its own.
The short answers. For anything else, ask the team.
CYCLOPS is dClimate's land management platform. It reads how land is managed from satellite images, every season: tillage and cover crops field by field for soil health, a crop carbon footprint, and biomass for restoration and forest projects.
It scores every field from satellite images on a 0 to 100 scale and sorts it into no-till, reduced till or conventional till, and flags where it sees a cover crop. It does this every season, so each one has its own record to show a verifier.
It turns farming practices into a carbon footprint (carbon intensity) in kilograms of CO₂-equivalent per bushel, for example to screen crops for the US 45Z clean-fuel credit. The figures are screening estimates; official qualification still requires the programme's own documentation.
Verra has named CYCLOPS one of seven vetted data providers for its restoration standard (VM0047). Verra still reviews every project on its own.
Draw a region, upload a shapefile or search a field ID. CYCLOPS covers farmland, agroforestry, restoring degraded land, standing forest and mangroves, on TESSERA, a 10-metre land model.
Tell us about your sourcing area, farmland programme or project, and we'll show you what CYCLOPS sees there, season by season.
Tell us about your sourcing area, farmland programme or project, and we'll show you what CYCLOPS sees there, season by season.
We use cookies to provide you with the best possible experience. They also allow us to analyse how the site is used so we can keep improving it. See our Privacy Policy.