Every asset on one map
Upload your locations and see them together, sized by expected loss and coloured by damage ratio, which is yearly loss as a share of value.
 AegisPrecision climate risk pricing for physical assets by dClimate
Aegis brings Wall Street’s portfolio tools to climate risk. It checks any asset against up to 14 perils, today and as the world warms, and tells you what they are likely to cost in an average year, for one address or a whole portfolio. A live tracker shows the impact of an event as it unfolds. And you can check the model for yourself, building by building, with its estimate beside the actual loss.
Aegis 14 perils scored
Tropical cyclone Coastal flood River flood Excessive rainfall Heat Drought Wildfire +7 more
Take the house at the top of the page. Here is how Aegis gets from its address to an annual figure you can plan around.
Type an address or drop a pin, then describe what stands there. Construction, roof and age all change how a building copes with wind and water.
A peril is a natural hazard that can cause damage, from floods to hail. Each gets a risk score from 1 (low) to 10 (high) for how exposed the spot is, before the building itself is taken into account.
Aegis goes back through 661 storms in the record for this spot since 1900 and works out what each would do to this house as it stands today. Hurricane Andrew passed at 167 mph in 1992. Here, it would cost about $1.69M.
Expected annual loss is the damage you'd expect in an average year, once quiet years and rare disasters are averaged out. For this house it is $38,107 a year, 2.01% of its value. Tropical cyclones make up 84% of it.
Example asset “US RES4” from the Example Assessment in Aegis. Location shown at region level. Figures are model estimates of structural damage, not quotes or forecasts of any single year.
A scenario is one path for the world’s emissions and the warming it brings by 2100. Pick one and see what the same house is likely to lose in an average year from 2027 to 2099.
Warming by 2100
This house’s average yearly loss, 2027–2099
$47,052a year
23% more than today’s $38,107
Example asset “US RES4” from the Example Assessment in Aegis. Each figure is the yearly loss averaged over 2027 to 2099; “today” is the 2027 figure. Model estimates of structural damage, not quotes or forecasts of any single year.
Aegis treats a portfolio the way a trading desk treats a book: every position visible, ranked and watched. Everything below is one example portfolio of 35 locations in 18 countries, worth $138.75 million.
Upload your locations and see them together, sized by expected loss and coloured by damage ratio, which is yearly loss as a share of value.
Rank every location by loss, damage ratio or risk score, and see each one's biggest peril at a glance.
See how often a hazard has struck since 2001, and how big a rare event could get as the climate changes.
Nemesis, bundled with Aegis, puts the model’s estimate beside the actual loss after an event, building by building.
Add one address or upload a CSV of thousands. Take results away as a PDF, as CSV or JSON, or pull them into your own tools with an API key.
 Aegis also works with EarthBoi, our AI climate scientist: ask about the climate risk of any US location in plain language.Meet EarthBoi
From our own published analysis and partnerships.
Aegis’s estimate of wind losses from Hurricane Ian on a real portfolio, against $200M reported. Calculated from wind damage only.
How much the example portfolio's expected yearly loss grows on the hottest path: from $380,025 today to $751,528 a year, averaged over 2027–2099.
US data centres in 48 states, assessed in one run. On roughly today's warming path, the loss from a 1-in-5-year hailstorm grows 68.7% by 2026–2055.
Read the analysis Partnership TCSAegis risk intelligence runs inside Tata Consultancy Services' Intelligent Urban Exchange for its clients worldwide.
Read the announcementBuildings and infrastructure can't move out of a storm's way. Aegis is for the people responsible for them.
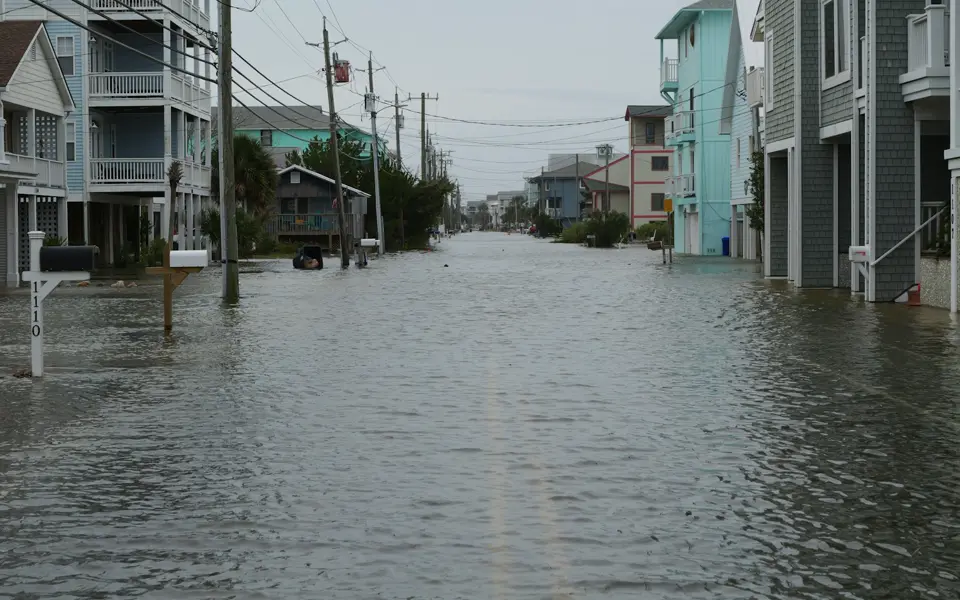
See where expected loss piles up before you price, renew or reinsure, with your deductibles applied.
The question it answers“Which properties carry most of our hurricane loss, and how does that change by 2056?”
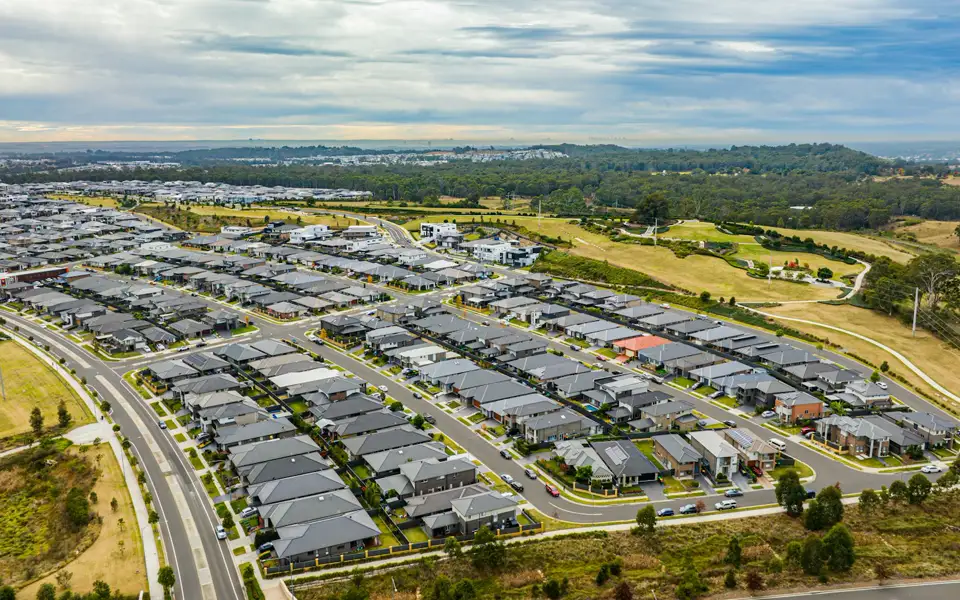
Know the climate risk behind a loan, today and over its whole term.
The question it answers“How does the yearly loss on these homes change over a 30-year mortgage?”

Compare sites before you buy and plan upgrades for the ones you hold.
The question it answers“Which of our buildings faces the biggest change in yearly loss across climate scenarios?”
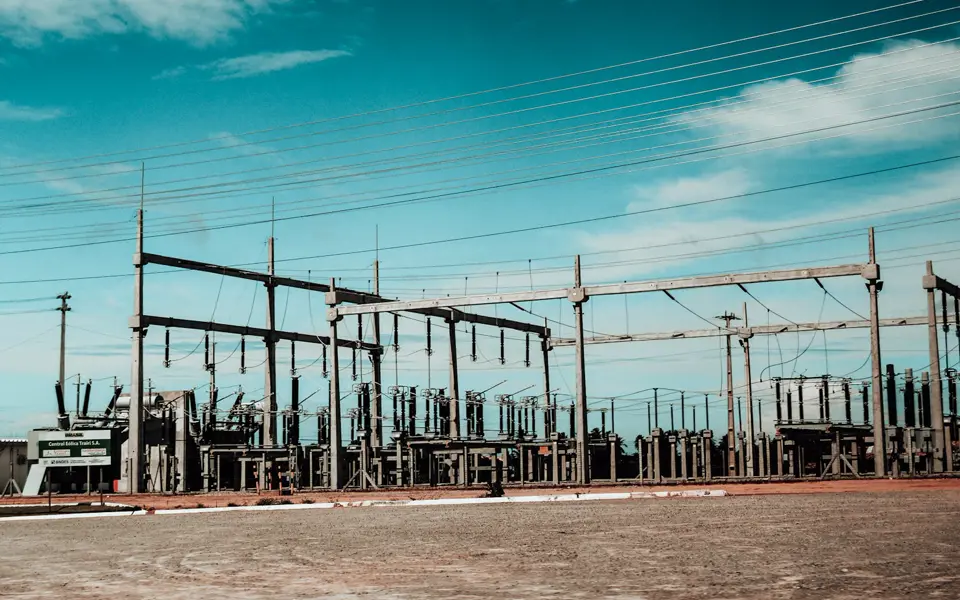
Plan for the hazards an asset will meet over decades of service.
The question it answers“Which perils will this substation face between now and 2099?”

See the risk you are funding, asset by asset, before you commit and while the season runs. Aegis prices, monitors and verifies climate risk in dollars, down to the single building. That is what lets new capital into the market.
The question it answers“Which buildings drive the expected loss on this layer, and how has the model done on them before?”
The short answers. For anything else, ask the team.
Aegis scores any location against 14 climate perils, today and under five warming scenarios, and shows the risk as expected annual loss in dollars, for one building or a whole portfolio.
The damage you'd expect in an average year, once quiet years and rare disasters are averaged out. For the example house on this page it is $38,107 a year, 2.01% of its value.
Fourteen: tropical cyclone, coastal flood, river flood, excessive rainfall, heat, cold, drought, wildfire, hail, tornado, thunderstorm wind, European windstorm, earthquake and tsunami.
Choose one of five warming scenarios, each a path for the world's emissions and the warming it brings by 2100, and see expected loss for periods from 2027 out to 2099.
Aegis's estimates have been checked against reported losses from real hurricanes, including Ian, Milton and Michael. Nemesis, bundled with Aegis, puts the model's estimate beside the actual loss after an event, building by building.
Yes. Add one address or upload a CSV of thousands, see every asset on one map and ranked in a table, and take results away as a PDF, as CSV or JSON, or through the API.
Open Aegis, explore the example portfolio, then add your own addresses.
We use cookies to provide you with the best possible experience. They also allow us to analyse how the site is used so we can keep improving it. See our Privacy Policy.